


Saturday Study Hall, Vol. 3
Evaluating hitters using exit velocity, max EV, EV50 and 90th-percentile EV

")
Saturday Study Hall is a biweekly series defining advanced stats, data and analytics to investigate how they impact the Royals.
Let’s cut to the chase: You know what exit velocity means. How hard a batter can hit a baseball is a fundamental aspect of the sport, and it’s a skill players strived for long before we had ways to measure it.
It should come as no surprise then that last year’s average EV leaderboard is basically a list of the best hitters in the sport, give or take the typical few outliers.

Among 252 qualifying hitters last year, average EV in MLB ranged from 83.4 MPH (Sal Frelick) to 96.2 MPH (Aaron Judge, of course). The median of 89 MPH (Spencer Torkelson) provides an easy baseline to remember when assessing a hitter: Anyone with an average EV above 89 MPH is passable and in the top half of the league; anyone below that will need to succeed in other ways (plate discipline, barrel control, achieving desirable launch angles, etc.)
But how does good/better/best EV equate to production? Major League averages from 2024 from varying velocity bands provide definitive proof that hitting the ball harder leads to improved outcomes (duh).
80-85 MPH: .199 batting average, .232 slugging percentage
85-90 MPH: .202 BA, .244 SLG
90-95 MPH: .237 BA, .309 SLG
95-100 MPH: .347 BA, .566 SLG
100-105 MPH: .525 BA, 1.049 SLG
105+ MPH: .691 BA, 1.545 SLG
A 95 MPH EV is considered the threshold for a “hard-hit” baseball, and you can see why in the bands above — there’s a massive jump from the 90-95 band to the 95-100 band. From that point forward, each band is exponentially better than the last.
It’s not a perfect way to look at the data as these are pretty large buckets, particularly 105+, but the importance is in the proof that, as you know, hitting the ball hard is #good.
A single exit velocity is a fine data point when analyzing an individual game. Average EV provides a baseline for an individual player over the course of a week, month, season or career.
However, there are more ways we can put EV data to use, such as maximum EV, EV50 and 90th-percentile EV.
Maximum Exit Velocity
A good measurement of raw power, maximum EV is a single data point showing the hardest-hit ball by an individual player. It’s a useful tool for prospects and younger players as it shows the type of power he may be able to tap into in the future.
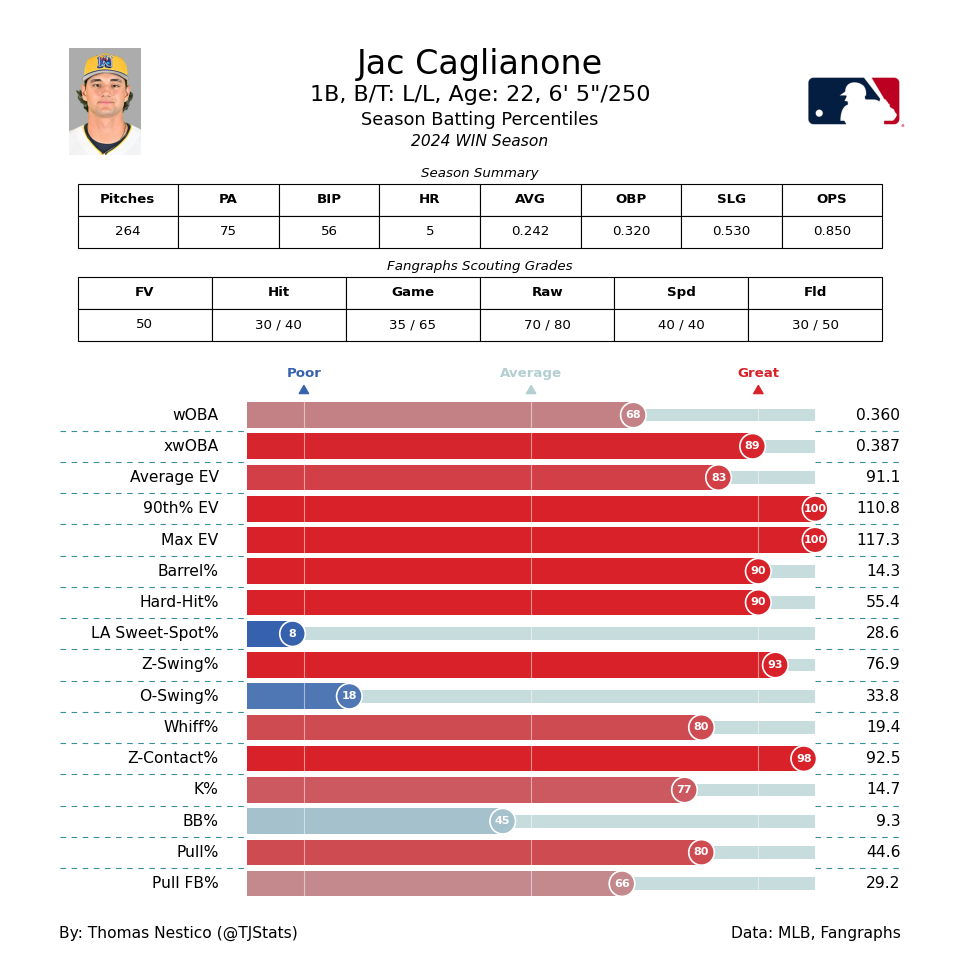
This is where we watch Jac Caglianone launch a missile the other way at a reported 120.9 MPH, an elite-of-the-elite mark.
This is also where I admit (for the first time) I’m not entirely confident the data is accurate — it is possible for the equipment (especially in Double-A, I would imagine) to produce misreads.
Yes, this ball is hit hard. No doubt about it. But 120.9 MPH would be the highest exit velocity *in recorded Major League history* to the opposite field.

I know, I know, party pooper. I’m not saying it’s impossible or even improbable that Caglianone has 121 MPH in the tank. He hit a ball 117 MPH during Arizona Fall League play last year, after all, but I had to get this lava hot take (especially in Royals country) off my chest.
Honestly, though, who am I to doubt this guy?
EV50
Back to business.
Similar to average exit velocity, EV50 is the average of the hardest 50% of batted balls for a hitter. Essentially, removing the lower-end outcomes to produce an average EV on a player’s upper-half contact.
90th-Percentile Exit Velocity
A sort of hybrid between maximum exit velocity and EV50, the 90th-percentile EV provides an average of a player’s absolute peak contact.
Rather than a maximum EV, which is just one tiny (still meaningful) data point, or a much broader top 50% EV, this metric shows both a player’s raw power AND how often he’s able to put it to use.
This is how I read 90th-percentile EV data, but someone smarter than I am may see it differently: A player who maxed out at 118 MPH but rarely gets to it — due to contact issues or poor barrel control, for example — will be docked. But one who possesses less raw power (say, 111 MPH max EV) but routinely puts it to good use will see a boost here.
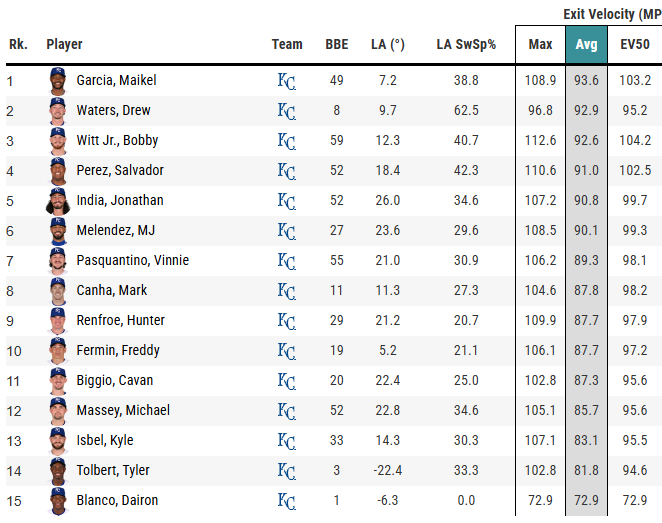
Data again from 2024, this time from Jon Anderson’s MLB Data Warehouse, an incredible resource you can (and should) subscribe to. (Minimum 50 balls in play.)

Royal Exit Velocities
Last season, Kansas City finished fourth in MLB with an 89.5 MPH average team EV. Funny enough, that’s exactly where they’re at so far in 2025; despite that, the offense has been abysmal through the first three weeks of the season.
Saturday Study Hall isn’t for analyzing this year’s team, though, so I’ll leave you with the individual statistics from this season and last to let you draw your own conclusions — for now.

Housekeeping
Quick update, subscribers! I plan to start publishing more short-form content (quick postgame thoughts, pitching breakdowns, etc.) under the Backdoor Changeups tab on the homepage.
These posts won’t go to your inbox (trying to avoid spamming people into oblivion) so you’ll need to check back regularly or follow on social media to see when new posts are live.
Additionally, I’m opening the opportunity for sponsorship. If you or someone you know owns a company, product or service you/they would like to promote, let’s partner! Opportunities exist to sponsor the newsletter itself, my nightly Royalty of the Game graphics shared on socials or both. Find more information on my About page.
End of sales pitch. Trust me, that was more uncomfortable for me than it was for you.
Very interesting. As for certain Royals hitters, a reminder that their EV is zero when they don’t make contact. I wonder if there’s a stat that combines contact rate and EV.
could just be bad luck. baseball is a game of patience. everyone needs to have some